Much has transpired on the economic front since terrorists attacked the U.S. on Sept. 11, 2001. The nation weathered two recessions; homeowners suffered record foreclosures; workers faced double-digit unemployment; and investors trudged through a lost decade -- stock markets aren't much better off today than they were ten years ago.
Not all of the problems that have plagued the U.S. economy can be tied to 9/11, though there are arguments to be made that some can. Judge for yourself. Here's a look at where the economy was a decade ago, on the eve of the terrorist attacks; where it is today; and what happened in between.
Federal Deficit
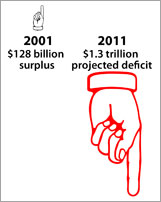 |
After 28 years of deficits, the federal government finally managed to produce a surplus for four straight years starting in 1998, including $236 billion in 2000 and $128 billion in 2001. Long-term prospects were rosy. "The outlook for the federal budget over the next decade continues to be bright," the Congressional Budget Office said in January 2001, forecasting an $889 billion surplus in 2011. Of course, the CBO's projection at the time assumed that revenue and spending policies would be maintained.
Now: Projected $1.3 trillion budget deficit in 2011
Sweeping tax cuts passed in June 2001 came at a time when the economy was already in recession on the heels of the dot-com bust. Then came 9/11. Subsequent wars in Iraq and Afghanistan have a price tag in excess of $1 trillion and counting. While the deficit actually shrank between 2004 and 2007, the Great Recession necessitated costly government intervention, including the Troubled Asset Relief Program of 2008 ($700 billion) and the economic stimulus package of 2009 ($800 billion). The federal deficit was $1.3 trillion in 2010. CBO projections put the deficit again at $1.3 trillion for 2011.
The Dow
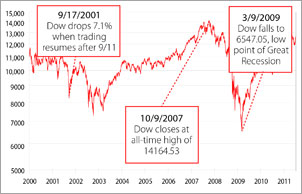 |
The Dow Jones Industrial Average climbed mightily in the 1990s, more than quadrupling in value during the decade as individual investors poured into the stock market. The 10,000 barrier was breached in 1999, and the sky seemed the limit. But the events of 9/11 dampened an already weakening economy. When trading resumed after the terrorist attacks, on Sept. 17, the Dow sank 684 points, or 7.1%. Lingering effects of a recession that officially ended in November 2001 kept the Dow from finding firm footing above 10,000 for another two years.
Now: The Dow closed at 11,493.57 on Sept. 1, 2011
The Dow topped 14,000 by October 2007, an all-time high. But the 18-month Great Recession, which began officially in December 2007, took a toll on the average—especially its financial components. Shares of American Express (AXP) fell 63% during 2008; Bank of America (BAC) dropped 60%. In September 2008, Kraft Foods (KFT) replaced American International Group (AIG) in the Dow. In June 2009, Citigroup (C) was bumped in favor of Cisco Systems (CSCO). The Dow has climbed 76% since its bear-market low of 6547 on March 9, 2009. Trading ahead of the tenth anniversary of 9/11 has been extremely volatile.
Unemployment
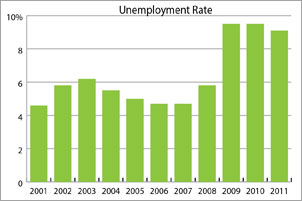 |
The unemployment rate was 4.2% at the start of 2001, but the unfolding recession lifted joblessness to 5.7% by year's end. The economic drag of 9/11 contributed to the labor pains. An estimated 600,000 jobs were lost as a direct consequence of the terrorist attacks. Of those lost jobs, 226,000 were in travel and tourism. At the World Trade Center, 1,100 businesses were disrupted. It took four years before the unemployment rate returned to its pre-9/11 level.
Now: 9.1% (August 2011)
After stabilizing at a healthy 5% or below in the mid 2000s, unemployment began to accelerate in 2008 as the Great Recession went into full swing. The U.S. ended up losing 2.6 million jobs that year. The jobless rate peaked in October 2009 at 10.1%, a level not seen since 1983. Today, about 14 million Americans are out of work, and there are few signs of rapid improvement on the labor front. Long-term unemployment remains a stubborn problem, with 6.0 million workers unemployed for at least 27 weeks.
Housing
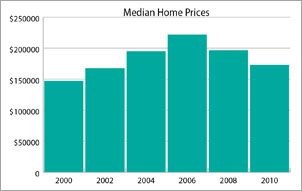 |
The median price of an existing home in the U.S. in 2001 was $156,600. The homeownership rate at the start of that year was 67.5%. The Federal Reserve had a tight monetary policy in place going into 2001, with the target on the federal funds rate at 6.5%. (The fed funds rate, the interest that banks charge each other for short-term loans, influences rates on other loans, such as mortgages.) As the recession unfolded, the Fed began to lower rates to stimulate economic growth. Four rate cuts were made in rapid succession after 9/11. The fed funds rate ended 2001 at 1.75%. By 2003 it was at a 50-year low of 1%.
Now: $173,100 (median home price in 2010)
A good case can be made that the Fed's super-low rate targets, which were prompted by the 2001 recession and exacerbated by the 9/11 attacks, played a key role in the housing bubble. From 2000 to 2005, housing prices rose at an 8.26% annualized rate, vs. 4.22% annualized during the 1990s. The median home price peaked at $221,900 in 2006. Then the bubble burst. The median price fell 2% in 2007, 10% in 2008 and 13% in 2009. It ticked up 0.6% in 2010, but at $173,100 it was well below peak prices. Homeownership, which hit a high point of 69.2% at the end of 2004, has since retreated to 65.9%, the lowest level in 13 years.
Air Travel
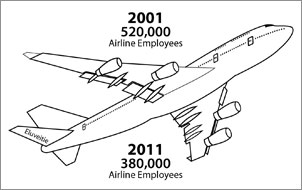 |
In August 2001, U.S. airlines carried 63.8 million passengers and employed more than 520,000 workers, but the 9/11 terrorist attacks had an immediate and profound effect on the industry. The number of passengers was nearly halved in September 2001, to 34.9 million. The federal government quickly intervened. The Air Transportation Safety and System Stabilization Act, signed into law Sept. 22, 2001, gave airlines $5 billion in immediate assistance and $10 billion in loan guarantees to prop up the industry.
Now: U.S. airlines flew 63.8 million passengers
U.S. airlines flew 63.8 million passengers in May 2011 (the latest data available), the same number that took flight in August 2001. But flying isn't the same as it was ten years ago. Among the travel-related legacies of the terrorist attacks are tighter carry-on restrictions and longer security lines at airports. Creation of the Transportation Security Administration, now part of the Department of Homeland Security, itself a direct result of 9/11, was approved on Nov. 19, 2001. The TSA currently has 50,000 employees and a budget of $8 billion. Due in large part to consolidation, the number of workers in the U.S. employed by airlines has fallen 26% since 9/11 to 383,000.
Gold
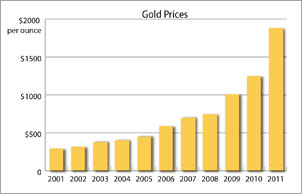 |
Then: $271.50 an ounce (Sept. 10, 2001)
It's no secret that some investors scurry to gold in times of uncertainty. Gold is considered a hedge against inflation and a weakening dollar, among other things. The week after 9/11 was no exception. Gold prices jumped a quick 8% on the heels of the terrorist attacks. The precious metal continued to rise steadily after 9/11, doubling in value by the end of 2005.
Now: $1821.00 an ounce (Sept. 1, 2011)
Gold shot into the $600s per ounce in 2006, a range where it bounced around until the second half of 2007. That's when signs of trouble at financial institutions, especially mortgage lenders, began to emerge. Gold first breached $1,000 in March 2008, but it wasn't until the fall of 2009 that prices stayed in the quadruple digits. Gold has exploded recently amid recession fears and stock-market volatility, surging past $1,800 an ounce. Since 9/11, the price of gold has gone up more than 600%. In contrast, the U.S. dollar has lost about one-third of its value since 9/11.
Oil & Gas
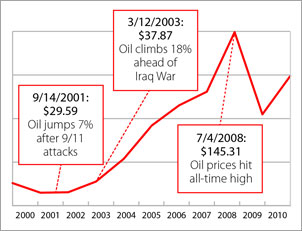 |
Oil is a commodity with a volatile history. Prices are often driven by global demand, the stability of producing nations and the whims of speculators. In the days after 9/11, the price of West Texas Intermediate crude rose 7% to $29.59 a barrel. However, oil quickly retreated as fears of economic slowdown trumped worries about scarce supply from the Middle East. Oil prices were little changed on the first anniversary of the terrorist attacks. As for gasoline, the national average weekly price for a gallon was $1.51 as of Sept. 10, 2001.
Now: $3.65 per gallon gasoline/$88.93 per barrel oil (Sept. 1, 2011)
Oil began to climb appreciably in 2004, and by 2008 it had been bid up to nearly $150 per barrel, largely due to concerns that global demand could outpace supply. Gasoline topped $4 per gallon in the summer of 2008. More recently, oil has fallen to $88.93 a barrel on a weaker outlook for worldwide demand. Gasoline is now at $3.55 per gallon, about $2 more than it went for on 9/11. Still, oil and gasoline are diminishing resources. According to the International Energy Agency, oil's share of total global energy will shrink from 33% in 2008 to 28% in 2035
No comments:
Post a Comment